Issue
Why does my WebVisualization for a Text Display not display values when I try to display Binary for a Byte variable using the %b notation?
Example:
When a Text Field is configured to display Binary of my BYTE variable "SR_Main.a"
in EcoStruxure Machine Expert with the Text = %b like the image below,

When the project is run, the result is that a static "%b" is shown and not the binary representation of the Variable:

Product Line
EcoStruxure Machine Expert
Environment
Codesys Web Visualization engine for Modicon M241/M251/M262 PLCs
Cause
The use of %b requires a Visualization Task and the addition of a WebVisualization node under the Visualization Manager.
Resolution
Here are the steps to add a Visualization:
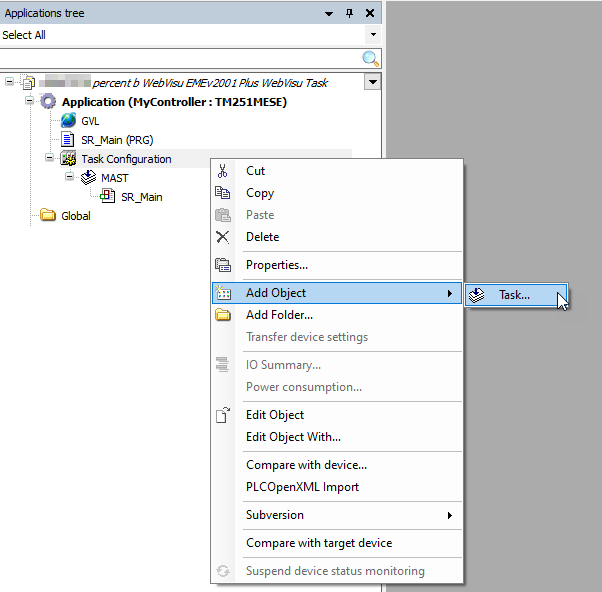
1) In the Applications Tree tab, Right-click on the Task Configuration node, hover your mouse over "Add Object >" and click on "Task..."

2) In the Add Task dialog, rename the Task to "VISU_TASK"

3) Click the Add button. As a result, you should see the new VISU_TASK created under the Task Configuration node:

4) Navigate to the Tools Tree, and right-click on "Visualization Manager"
5) Hover your mouse over "Add Object >" and click on "WebVisu...". Use the default name "WebVisualization" and click Add.

As a result, you should see two new nodes appear.
a) Under the Task Configuration -> VISU_TASK, you should see a new "VisuElems.Visu_Prg" POU call automatically created.
b) Under the Visualization Manager node, you should see the new "WebVisualization" node.

6) Download and Run your project
The result will be that the Text object will now show the Binary representation of the BYTE variable:

If this FAQ did not solve your issue, you can chat with us at chat with us or e-mail us at customer.services@se.com to create a case with our Technical Support Team.
If you are not located in North America, please contact your local Customer Care Center for assistance:
Support | Schneider Electric Global (se.com)
Why does my WebVisualization for a Text Display not display values when I try to display Binary for a Byte variable using the %b notation?
Example:
When a Text Field is configured to display Binary of my BYTE variable "SR_Main.a"
in EcoStruxure Machine Expert with the Text = %b like the image below,
When the project is run, the result is that a static "%b" is shown and not the binary representation of the Variable:
Product Line
EcoStruxure Machine Expert
Environment
Codesys Web Visualization engine for Modicon M241/M251/M262 PLCs
Cause
The use of %b requires a Visualization Task and the addition of a WebVisualization node under the Visualization Manager.
Resolution
Here are the steps to add a Visualization:
1) In the Applications Tree tab, Right-click on the Task Configuration node, hover your mouse over "Add Object >" and click on "Task..."
2) In the Add Task dialog, rename the Task to "VISU_TASK"
3) Click the Add button. As a result, you should see the new VISU_TASK created under the Task Configuration node:
4) Navigate to the Tools Tree, and right-click on "Visualization Manager"
5) Hover your mouse over "Add Object >" and click on "WebVisu...". Use the default name "WebVisualization" and click Add.
As a result, you should see two new nodes appear.
a) Under the Task Configuration -> VISU_TASK, you should see a new "VisuElems.Visu_Prg" POU call automatically created.
b) Under the Visualization Manager node, you should see the new "WebVisualization" node.
6) Download and Run your project
The result will be that the Text object will now show the Binary representation of the BYTE variable:
If this FAQ did not solve your issue, you can chat with us at chat with us or e-mail us at customer.services@se.com to create a case with our Technical Support Team.
If you are not located in North America, please contact your local Customer Care Center for assistance:
Support | Schneider Electric Global (se.com)
게시 대상:슈나이더 일렉트릭 Korea


