


How do we control the Y-axis range in the Historical Trend Graph in Vijeo Designer
Issue:
Looking for a way to have a variable Y-axis range in the Historical Trend Graph
Product Line:
Vijeo Designer
Resolution:
In order to dynamically control the Y-axis value range for a Historical Trend Graph in Vijeo Designer, we need to do the following:
1) Create some new variables: ValueRangeMin and ValueRangeMax
2) On your panel where the Historical Trend is drawn, add two Numeric Displays, one for each variable.
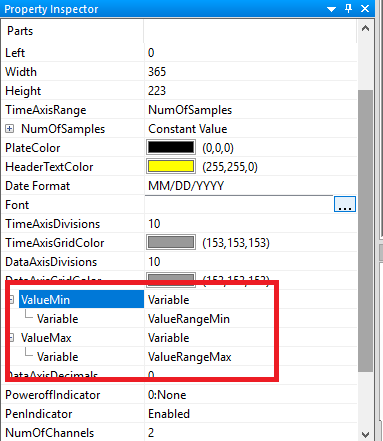
3) In the Property Inspector of the Historical Trend Graph, find the properties "ValueMin" and "ValueMax".
4) Change the properties to use "Variable" instead of "Constant"
5) Assign the respective variables to the properties.
Please see screen shot below:
Looking for a way to have a variable Y-axis range in the Historical Trend Graph
Product Line:
Vijeo Designer
Resolution:
In order to dynamically control the Y-axis value range for a Historical Trend Graph in Vijeo Designer, we need to do the following:
1) Create some new variables: ValueRangeMin and ValueRangeMax
2) On your panel where the Historical Trend is drawn, add two Numeric Displays, one for each variable.
3) In the Property Inspector of the Historical Trend Graph, find the properties "ValueMin" and "ValueMax".
4) Change the properties to use "Variable" instead of "Constant"
5) Assign the respective variables to the properties.
Please see screen shot below:
Gepubliceerd voor: Schneider Electric Belgium
Hulp nodig?
Selecteer zelf het juiste product
Vind snel en eenvoudig de juiste producten en toebehoren voor uw toepassingen.
Offerte aanvragen
Dien uw aanvraag online in en een expert zal contact met u opnemen.
Verkooppunten
Vind eenvoudig de dichtstbijzijnde distributeur van Schneider Electric op uw locatie.
Help Center
Vind de antwoorden die u nodig heeft via bladeren door veelgestelde vragen over onderwerpen.