


How do we control the Y-axis range in the Historical Trend Graph in Vijeo Designer
Issue:
Looking for a way to have a variable Y-axis range in the Historical Trend Graph
Product Line:
Vijeo Designer
Resolution:
In order to dynamically control the Y-axis value range for a Historical Trend Graph in Vijeo Designer, we need to do the following:
1) Create some new variables: ValueRangeMin and ValueRangeMax
2) On your panel where the Historical Trend is drawn, add two Numeric Displays, one for each variable.
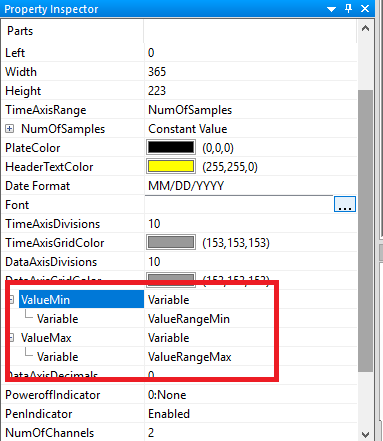
3) In the Property Inspector of the Historical Trend Graph, find the properties "ValueMin" and "ValueMax".
4) Change the properties to use "Variable" instead of "Constant"
5) Assign the respective variables to the properties.
Please see screen shot below:
Looking for a way to have a variable Y-axis range in the Historical Trend Graph
Product Line:
Vijeo Designer
Resolution:
In order to dynamically control the Y-axis value range for a Historical Trend Graph in Vijeo Designer, we need to do the following:
1) Create some new variables: ValueRangeMin and ValueRangeMax
2) On your panel where the Historical Trend is drawn, add two Numeric Displays, one for each variable.
3) In the Property Inspector of the Historical Trend Graph, find the properties "ValueMin" and "ValueMax".
4) Change the properties to use "Variable" instead of "Constant"
5) Assign the respective variables to the properties.
Please see screen shot below:
Udgivet til: Schneider Electric Danmark
Brug for hjælp?
Produktvælger
Find hurtigt og nemt de rette produkter og det rette tilbehør til dine anvendelser.
Få et tilbud
Start din salgsforespørgsel online, så vil du blive kontaktet af en ekspert.
Find forhandler
Find den nærmeste Schneider Electric-distributør.
Hjælpecenter
Find supportressourcer til alle dine behov på ét sted.