Issue
A meter is customized to record a custom log when when a disturbance occurs. The user would like to display the custom log and the disturbance records on the same table in vista.
Product Line
PME 8.x
PME 9.0
PME 2020
Environment
Vista
Cause
End user would like to know how to add custom quantities to the sag/swell data log viewer in log viewer in Vista
Resolution
*Warning: Take backups of any files prior to modifying them. Ensure the backups are in a location that will not be overwritten (i.e. the Desktop).
*Note: Any modifications made to the Vista diagrams will affect all meters of that device type.
Resolution 1: Create a new custom data log viewer that merges the disturbance logs and the custom log
1 - Open the meter's diagram's in PME Vista and create a new Data Log Viewer.
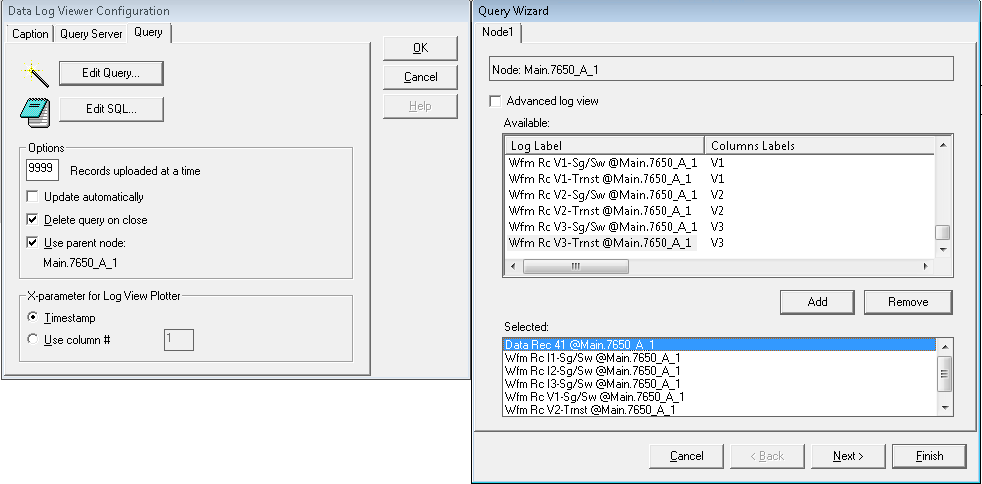
2 - Right click on the new Data log view created and navigate to Edit Query as shown below:

3 - Select the desired custom Log and then click Add. Repeat this step for each disturbance record channel. Press next after adding all the waveform channels
4 - For each table, add the columns required such as the desired quantities and Timestamp. Press next once all the quantities from each table have been added.
5 - It's recommended to sort the table by timestamp. Click finish to create the new Data Log Viewer. Double click on the new log to view it as shown below:

Resolution 2: Edit the disturbance log using the EDIT SQL mode to include the meter event log entries.
1 - First, make sure the quantity being logged generates an event by navigating to the meter's event log.
2 - In the example below, the meter generated an waveform event when an external pulse was trigged (EPSS_Door). We Noted down the "Effect" column.

3 - Navigate to the meter's Power Quality tab and then right click on the disturbance recorder (Sag/swell).
4 - On the query tab, click on Edit SQL.
5 - In the notepad window, add a new line to the first where clause: Or effect_ion Like 'Effect name from step 2 ' as shown in the example below.

6 - The where clause can include other constrains such as cause value or cause columns.
7 - Navigate to file --> save within notepad. *Note: The customization will not take effect if the query is not saved.*
8 - Open the data log viewer to test the new changes as shown below:

A meter is customized to record a custom log when when a disturbance occurs. The user would like to display the custom log and the disturbance records on the same table in vista.
Product Line
PME 8.x
PME 9.0
PME 2020
Environment
Vista
Cause
End user would like to know how to add custom quantities to the sag/swell data log viewer in log viewer in Vista
Resolution
*Warning: Take backups of any files prior to modifying them. Ensure the backups are in a location that will not be overwritten (i.e. the Desktop).
*Note: Any modifications made to the Vista diagrams will affect all meters of that device type.
Resolution 1: Create a new custom data log viewer that merges the disturbance logs and the custom log
1 - Open the meter's diagram's in PME Vista and create a new Data Log Viewer.
2 - Right click on the new Data log view created and navigate to Edit Query as shown below:
3 - Select the desired custom Log and then click Add. Repeat this step for each disturbance record channel. Press next after adding all the waveform channels
4 - For each table, add the columns required such as the desired quantities and Timestamp. Press next once all the quantities from each table have been added.
5 - It's recommended to sort the table by timestamp. Click finish to create the new Data Log Viewer. Double click on the new log to view it as shown below:
Resolution 2: Edit the disturbance log using the EDIT SQL mode to include the meter event log entries.
1 - First, make sure the quantity being logged generates an event by navigating to the meter's event log.
2 - In the example below, the meter generated an waveform event when an external pulse was trigged (EPSS_Door). We Noted down the "Effect" column.
3 - Navigate to the meter's Power Quality tab and then right click on the disturbance recorder (Sag/swell).
4 - On the query tab, click on Edit SQL.
5 - In the notepad window, add a new line to the first where clause: Or effect_ion Like 'Effect name from step 2 ' as shown in the example below.
6 - The where clause can include other constrains such as cause value or cause columns.
7 - Navigate to file --> save within notepad. *Note: The customization will not take effect if the query is not saved.*
8 - Open the data log viewer to test the new changes as shown below:
Released for:Schneider Electric Ireland


